

In the past couple of years, the market for digital currencies, commonly known as cryptocurrencies because transactions are verified using cryptography, has expanded significantly in terms of transaction volumes, market capitalization, and the number of digital currencies in existence. On January 1, 2018, the market capitalizations (market caps1) of Bitcoin and Ethereum were $226 billion and $75 billion, respectively. By May 10, 2021, Bitcoin’s market cap had reached almost $1 trillion and Ethereum’s $478 billion.
In this article, I measure the market’s interconnections in term of prices and volatility. Measuring interconnection (or connectedness) is important for both measuring and managing risk. The more the market is connected, the more sensitive it is to shocks. While the cryptocurrency market is not very large relative to the other markets studied in the literature, it is growing at a fast pace and a preliminary assessment might be useful. Moreover, the risk associated with a portfolio of cryptocurrencies is not simply a weighted sum of the risks of its components; rather, the overall risk depends on how the pieces interact—whether and how they are connected. Similarly, in an interconnected market, the risk of a single currency does not depend only on its own idiosyncratic characteristics, but also on the volatility of other currencies and on the extent to which they are interconnected.
My goal in this Chicago Fed Letter is to examine how cryptocurrencies are interconnected via prices and volatility spillovers. By spillover, I mean the propagation of variations in the price or volatility (a proxy for risk) of a digital currency to all the remaining cryptocurrencies in the market, and vice versa, the propagation of price variations in the market to a specific digital currency. It is important to understand the level of interconnectedness because it allows us to quantify the amount of risk that characterizes the cryptocurrency market. I carry out these analyses by considering a large set of digital currency prices and volatilities and by using the dynamic network connectedness measures developed by Diebold and Yilmaz (2009, 2012).
I find that, perhaps unsurprisingly, the cryptocurrency market is extremely interconnected. For example, the connectedness index values I compute using different specifications, sample sizes, and time windows range between 86% and 97% (where 100% indicates maximum connectedness). This means that most of the variations in the prices in the cryptocurrency market are the results of the market’s spillovers and only a small fraction can be ascribed to the idiosyncratic characteristics of individual digital currencies. In other words, most of the market volatility is the result of the linkages that amplify and reverberate any price movements in the market. These strong spillovers could be the results of aggregate or common shocks influencing the market as a whole, e.g., the downward trend in 2018 and the upward trend in 2020. From this perspective, the total cryptocurrency market capitalization is more important than the price or the market cap of single currencies. Finally, from a risk-management perspective, this also suggests that it would be very difficult to create a diversified portfolio of cryptocurrencies.
Methodology
One simple way to measure interdependencies and linkages across pieces of a system or market is to look at pairwise correlations. While informative, these measures offer only a limited understanding of interconnection as they disregard the multidimensional and dynamic nature of the linkages across units. For example, the price movement of, say, Ethereum today might influence the price of some cryptocurrencies simultaneously and some others with some time lag. These types of linkages would not be picked up by looking at pairwise correlations.
It is important to allow for a richer set of interdependencies and consider models that allow for full multivariate dynamic cross-variable interaction, thereby permitting a more accurate measurement of connectedness. In this context, the vector autoregressive (VAR) model is a natural candidate as it is often employed to construct measures of spillovers and connectedness. For this purpose, I specify the VAR such that the individual cryptocurrencies can be thought of as parts of an interconnected market. The flexibility of the VAR structure allows me to match the dynamic correlations of the price and volatility2 of digital currencies with good precision and, hence, to summarize their interdependencies fairly well.
To assess the extent of interconnections among cryptocurrencies, I use the dynamic connectedness measures proposed by Diebold and Yilmaz (2012). I measure the connectedness across units as the relative importance of the exogenous variations of one cryptocurrency in explaining variations in another cryptocurrency—for example, the fraction of the price fluctuations in Bitcoin attributable to fluctuations in the price of Ethereum that spill over to the price of Bitcoin. In the VAR context, this corresponds to decomposing the volatility3 of the price of a cryptocurrency into two parts: the portion explained by its own idiosyncratic price variations and the portion explained by price variations originating somewhere else in the cryptocurrency market. This volatility decomposition assesses how much of the variation in the cryptocurrency is due to imported shocks (vulnerability) or how important one cryptocurrency is in spreading its own shocks elsewhere (systemic spread).
The sum of all the portions of volatility explained by “non-own” price variations defines the overall connectedness index, which measures the contribution of the spillovers of price or volatility shocks across all classes of cryptocurrencies to the overall market volatility. In the hypothetical situation where digital currencies move independently from each other, there would be no spillovers from one currency to the others, and the connectedness index would be zero. The relative magnitudes of the non-own price variations offer an indication of the level of overall connectedness.
I base my analysis on two VAR specifications. One specification considers the daily log price and volatility of 19 cryptocurrencies4 downloaded from coinbase.com and investing.com. While it is important to acknowledge that prices for the same cryptocurrency can vary across trading venues, these websites represent popular platforms to gauge dollar values of many cryptocurrencies. Although I have data at earlier dates for some cryptocurrencies, the full dimension of the cross section starts on January 1, 2018. The sample ends on May 10, 2021, leading to a fairly large time-series dimension, i.e., 1,227 data points (large T, medium N). The second specification considers the log price and volatility of 33 cryptocurrencies5 from January 1, 2020, to May 10, 2021 (478 data points). In this case, the size of the cross section is large, and the length of time series is shorter (medium T, large N). It might be interesting to see if connectedness measures change when the cross section gets larger.
Since in both specifications the number of variables is not trivial, the estimation of an unrestricted VAR is problematic because the number of parameters to be estimated is very large, even if one uses just one lag. To reduce the curse of dimensionality, I consider both regularization approaches and Bayesian shrinkage. By regularization, I mean techniques that employ a penalty function in the estimation of the coefficients, therefore producing a more parsimonious estimation problem and estimates with smaller variance. I use the following techniques: ridge (where parameters are penalized with a quadratic function), lasso (where parameters are penalized with an absolute value function), and elastic net estimators (which combine the ridge and lasso estimators). With Bayesian shrinkage, I refer to priors that favor a unit-root behavior of the single units, so that a priori I assume no interconnections among digital currencies. In both cases, penalization and shrinkage are controlled by a set of hyperparameters whose values are chosen optimally. I estimate the VAR using three lags and set the horizon of connectedness (i.e., the horizon of the forecast error variance) to 12 days.
Results
Figure 1 reports the overall connectedness index across cryptocurrencies’ prices and volatilities computed using different penalization approaches and priors for the two sample periods, i.e., from January 1, 2018, to May 10, 2021, and from January 1, 2020, to May 10, 2021.
1. Connectedness index of cryptocurrency market
| Bayesian shrinkage | Ridge | Lasso | Elastic net | ||
|---|---|---|---|---|---|
| Prices | large T medium N |
86 | 88 | 94 | 94 |
| medium T large N |
96 | 96 | 96 | 97 | |
| Volatility | large T medium N |
93 | 91 | 91 | 89 |
| medium T large N |
95 | 96 | 96 | 96 |
Regardless of the sample size, priors, or regularization approach I use, I find the cryptocurrency market to be extremely interconnected. In particular, the results shown in the first row of figure 1 suggest that in the past couple of years, 86% to 94% of cryptocurrency price uncertainty is due to non-own shocks or market spillovers, i.e., price fluctuations that originate from some or a set of cryptocurrencies and propagate to the rest of the digital currencies in the market. This percentage increases when I consider a larger pool of digital currencies. Moreover, in figure 2, I report the overall connectedness index computed over time, i.e., on overlapping windows of 200 calendar days from January 1, 2018, until May 10, 2021, in order to capture possible time instabilities. The connectedness index has remained fairly stable and significantly above 90% since 2018. This result suggests that the uncertainty (or risk) associated with the price of a digital currency does not depend much on its own idiosyncratic characteristics and rather more on the price fluctuations of all the other digital currencies in the market. Hence, the market is very interconnected and sensitive to shocks. Moreover, the risk associated with a portfolio of digital currency would be very concentrated. Similar conclusions can be drawn when looking at the volatility spillovers of figure 1.
2. Rolling connectedness index
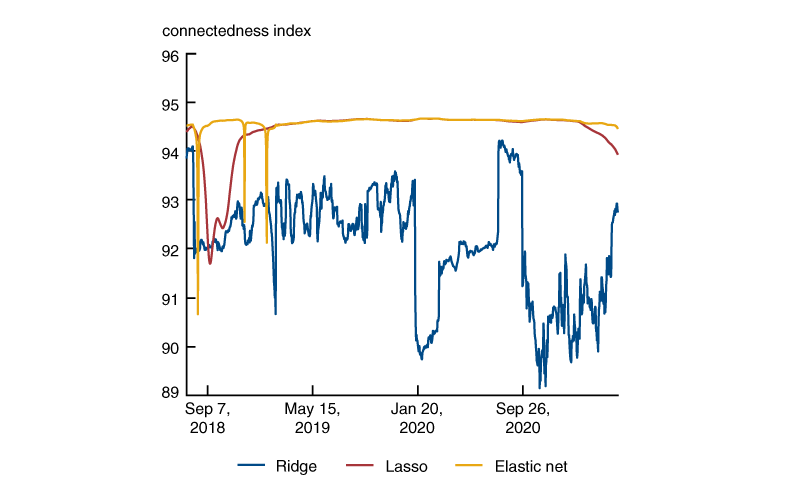
Figure 3 reports the directional spillover from a specific cryptocurrency to the rest of the market over the longer sample. This measures the extent to which the fluctuations in the price of a digital currency influence, on average, the price of other digital currencies, e.g., a synthetic measure of the level of systemic spread from individual units. Directional spillovers tend to be of small magnitudes. The currency that generates the largest directional spillover is Bitcoin; in particular, about 10% of price fluctuations in other currencies originate from fluctuations in the price of Bitcoin. Similar systemic importance is attributed to Cardano and Ethereum, which represent individually a nontrivial fraction of the total cryptocurrency market cap. Two other important players in terms of market cap, Binance Coin and XRP, do not generate significant spillovers. The directional spillover received by each digital currency turns out to be small and with little variation across currencies (not shown here). In summary, the results in figure 3 indicate that directional spillovers over the full sample period are quite low. Each currency individually has a small spillover to the prices of other currencies, but taken together, these spillovers are much larger than the idiosyncratic shocks to each currency.
3. Systemic spread: Average directional spillovers from one cryptocurrency to others
| Cryptocurrency | Index |
|---|---|
| Bitcoin | 10.3 |
| Cardano | 10.3 |
| Ethereum | 9.8 |
| VeChain | 8.9 |
| Bitcoin Cash | 8.0 |
| Monero | 7.8 |
| Dash | 7.6 |
| Zcash | 7.3 |
| NEM | 6.8 |
| TRON | 5.1 |
| Litecoin | 5.0 |
| IOTA | 3.0 |
| Stellar | 2.5 |
| Neo | 1.9 |
| EOS | 1.5 |
| Ethereum Classic | 1.4 |
| XRP | 1.3 |
| Binance Coin | 0.5 |
| Qtum | 0.5 |
An alternative way to interpret these patterns is to acknowledge that common or aggregate shocks might be the source of the strong spillovers in the market as a whole. When looking at the covariance structure of the unpredictable component of price variations, i.e., the VAR residuals, it turns out that one latent factor explains a large portion of these fluctuations, suggesting a lot of commonality in the cryptocurrency market. I find inconclusive evidence that this latent factor could be associated with a specific currency or a subset of them—a result that echoes the results of the analysis with the VAR. Rather, the evolution of this common component over time seems to capture market trends, i.e., the downward trend in 2018 and the upward trend in 2020.
Conclusion
Given the very rapid expansion in the cryptocurrency market in the past several years, I examine the level of interconnectedness in the market and discuss some implications for risk measurement and management. I do so by analyzing measures of prices and volatility spillovers across a large set of digital currencies. My analysis suggests that the cryptocurrency market is extremely interconnected. For example, the connectedness index values I compute using different specifications, sample sizes, and time windows are above 90%. This means that most of the variations in the prices of currencies in the market result from the market’s spillovers and only a small fraction can be ascribed to the idiosyncratic characteristics of individual digital currencies. These strong spillovers could be the results of aggregate or common shocks influencing the market as a whole. Bitcoin, the largest currency by far in terms of market cap, has only limited influence on the price and volatility of the other cryptocurrencies. Indeed, Bitcoin’s price fluctuations only explain 10% of the fluctuations of the other currencies in the market.
Notes
1 The market cap of a cryptocurrency equals the current price of the currency in U.S. dollars times the total number of tokens in the market, often referred to as circulating supply.
2 Daily volatility is computed using the square difference between the logs of high and low prices. I obtain similar results considering the alternative daily range-based realized volatility used in Demirer et al. (2018).
3 In particular, I work with the variance–covariance matrix of the forecast error at specific horizons. In the literature, the identification of unit-specific shocks is typically based on the generalized moving average representation of the VAR, as discussed in Pesaran and Shin (1998), which is thought to be convenient as it produces variance decompositions that are invariant to the ordering of the variables.
4 Binance Coin, Bitcoin, Bitcoin Cash, Cardano, Dash, EOS, Ethereum, Ethereum Classic, IOTA, Litecoin, Monero, NEM, Neo, Qtum, Stellar, TRON, VeChain, XRP, Zcash.
5 Binance Coin, Bitcoin, Bitcoin Cash, Bitcoin SV, BitTorrent, Cardano, Chainlink, Cosmos, Dai, Dash, Decred, Dogecoin, EOS, Ethereum, Ethereum Classic, FTX Token, Huobi Token, IOTA, Litecoin, Maker, Monero, NEM, Neo, Polygon, Qtum, Stellar, THETA, TRON, UNUS SED LEO, USD Coin, VeChain, XRP, Zcash.


